Crashlytics in the Firebase Console
Overview#
Once you have Crashlytics setup, you can navigate to Crashlytics in your Firebase Console underneath 'Quality'. If this page tells you to setup, build or run your app, then you have not correctly setup Crashlytics in your app (see Usage)
Crashlytics is enabled by default, to disable it in debug mode (recommended) or for opt-in purposes see toggle Crashlytics collection.
When using any of the examples under usage, you will be shown a dashboard similar to the following:
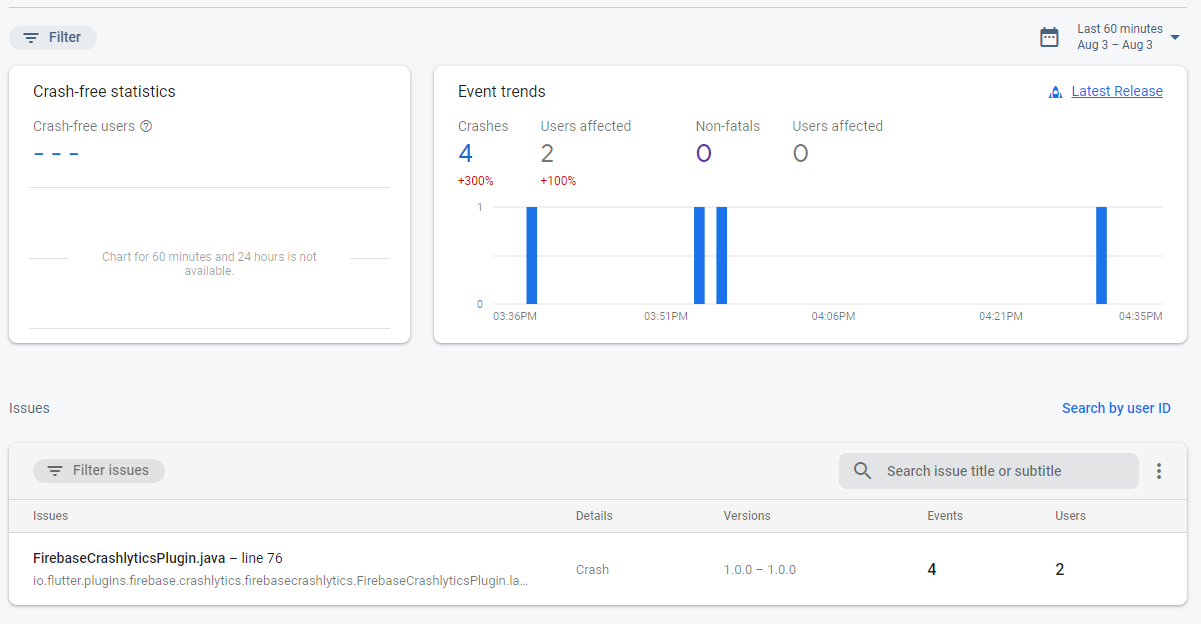
Here you can see that the crash was ran 4 times in the last 60 minutes.
Error reports are only uploaded to Crashlytics upon relaunching the app
Issues#
The issues section of the Crashlytics console shows all the reports from your app, and organizes them into separate issues.
One of the issues above originates from FirebaseCrashlyticsPlugin.java, which is the module responsible for testing the
Crashlytics crash method by throwing an uncaught exception to crash the app. Using the crash method on the same platform
will always add reports to the same issue.
Filtering crash types#
The Crashlytics console allows you to filter your issues by event types such as Crashes and Non-fatals.
In the below example, you can see our project filtered by Non-fatal crashes.
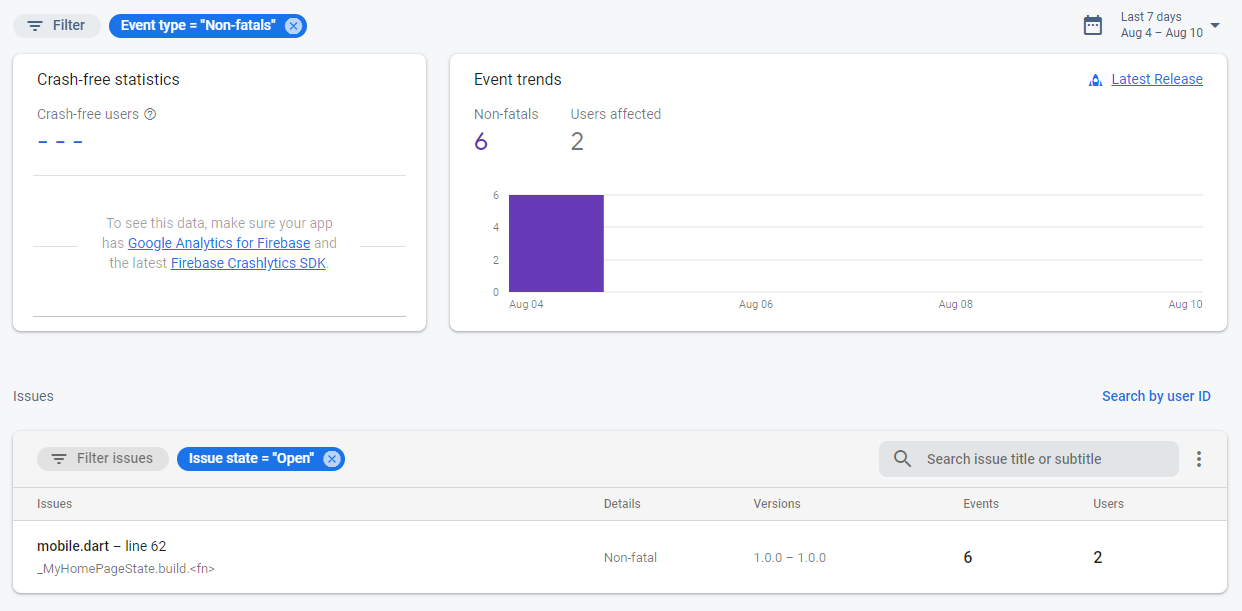
In the issues section, it shows us that the event was triggered in the mobile.dart file on line 62, which is the below
code snippet:
Managing issues#
By clicking on an issue, you can view its statistics and associated reports in more detail. The below screenshot shows the
issue relating to FirebaseCrashlyticsPlugin.java
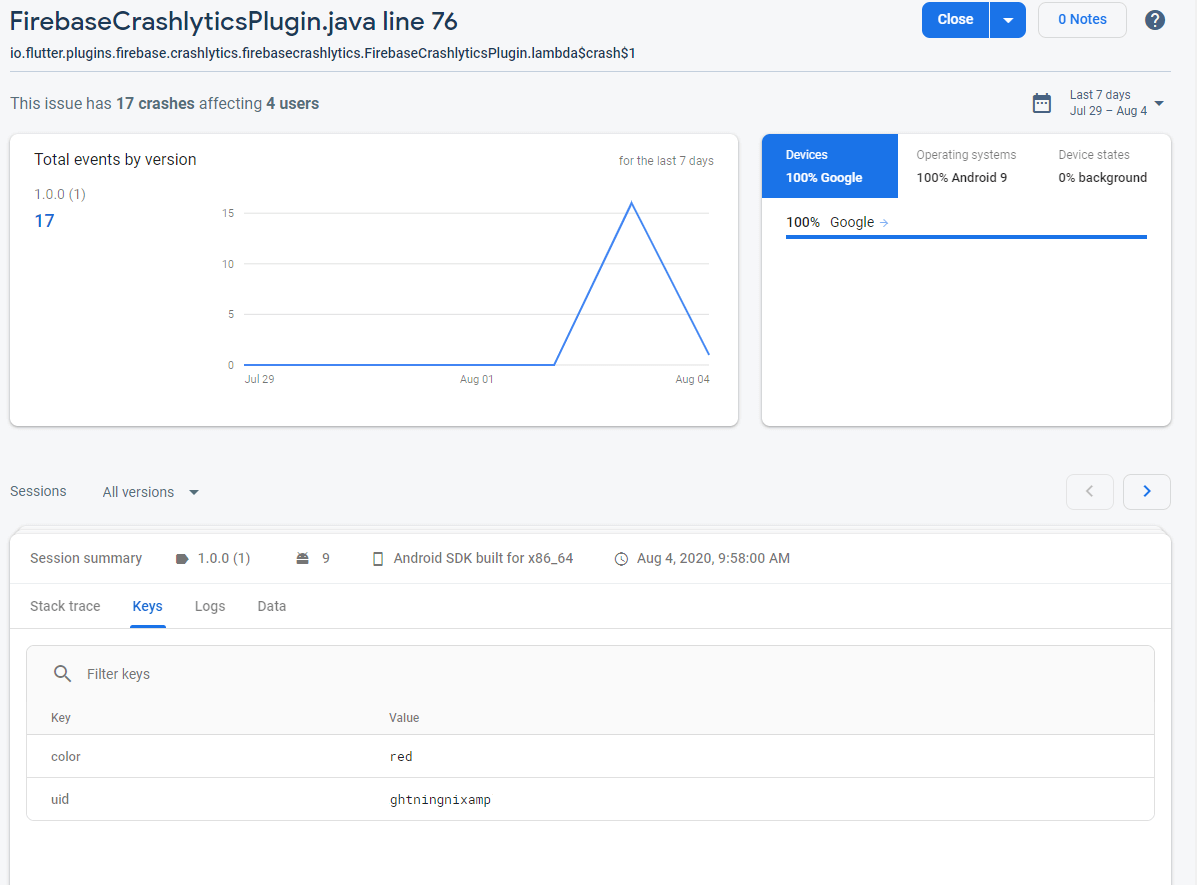
Here you can see a breakdown of the issue, that shows events by versions, devices and operating systems. Below that, you
can browser specific reports and view their content. In our example, you can see that we have used the setCustomKey method
to add in our custom attributes. Under the log section, you can see any messages added by the log method
Closing issues#
At the top right of the issue, there is a button that says "Close." After addressing the issue, you can close it, allowing you to filter this out on the dashboard. When the same issue re-occurs, it will automatically open again. If you want to prevent this from happening, click the drop down arrow next to the button and select mute.